Gaze-enhanced Graph Network Visualizations
Description: Immersive Analytics is a quickly evolving field that unites several areas such as visualisation, immersive environments, and human-computer interaction to support human data analysis with emerging technologies. Meanwhile, eye tracking provides valuable insights into usability issues and interaction patterns, which is widely applied to immersive environments like VR.
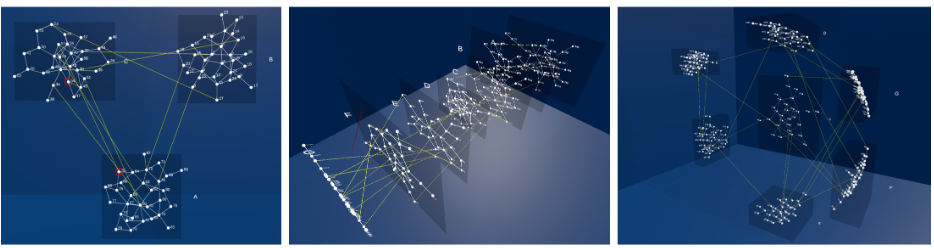
When visualisations (usually 3D) were presented in an immersive environment like VR, users sometimes got lost because of the complex and entangled data. Could we use gaze data to adapt graph network visualisations for a better representation?
Goal:
- Set up and test experiment VR environment with eye tracking (HMD: Quest 3 + Neon XR)
- Properly design, implement, and conduct the user study
- Data analysis
Supervisor: Yao Wang
Distribution: 10% Literature Review, 50% VR Environment Implementation, 20% Data collection & processing, 20% Evaluation & analysis
Requirements: good programming skill, ideally some experience with either JavaScript (WebGL) or C# (Unity).
Literature: [1] Feyer, S. P., et al. "2D, 2.5 D, or 3D? an exploratory study on multilayer network visualisations in virtual reality". IEEE Transactions on Visualization and Computer Graphics 2023. Paper link.
[2] Tadeja, Slawomir Konrad, Timoleon Kipouros, and Per Ola Kristensson. "Exploring parallel coordinates plots in virtual reality." Extended Abstracts of the 2019 CHI Conference on Human Factors in Computing Systems. 2019. Paper link.
[3] Pathmanathan, Nelusa, et al. "Been There, Seen That: Visualization of Movement and 3D Eye Tracking Data from Real‐World Environments." Computer Graphics Forum. Vol. 42. No. 3. 2023. Paper link.